Technical names can’t be changed, be careful.
Data warehouse stores the data which is not used so frequently.
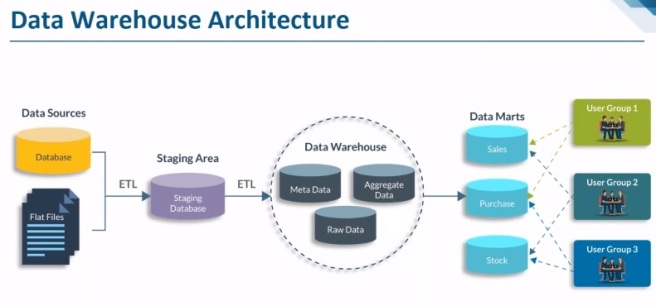
Enterprise DW is used to collect the data from different source, consolidate, cleaning.
BW Will not impact on operational system i.e. insert, update, delete
Data can come from multiple diverse systems
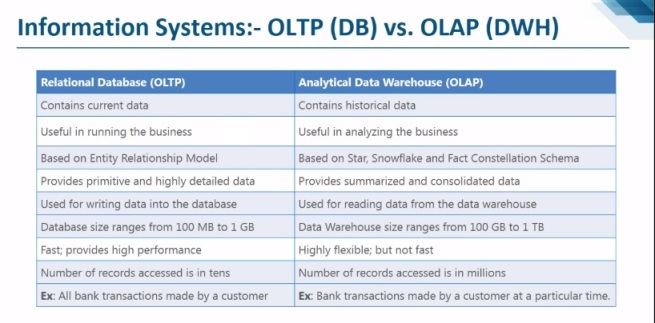
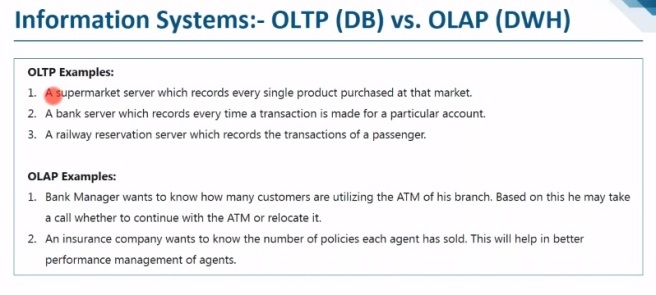
– OLTP (On-line Transaction Processing) is characterized by a large number of short on-line transactions (INSERT, UPDATE, and DELETE). The main emphasis for OLTP systems is put on very fast query processing, maintaining data integrity in multi-access environments and an effectiveness measured by number of transactions per second. In OLTP database there is detailed and current data, and schema used to store transactional databases is the entity model (usually 3NF).
– OLAP (On-line Analytical Processing) is characterized by relatively low volume of transactions. Queries are often very complex and involve aggregations. For OLAP systems a response time is an effectiveness measure. OLAP applications are widely used by Data Mining techniques. In OLAP database there is aggregated, historical data, stored in multi-dimensional schemas (usually star schema).
|
|
OLTP System
Online Transaction Processing
(Operational System) |
OLAP System
Online Analytical Processing
(Data Warehouse) |
| Source of data |
Operational data; OLTPs are the original source of the data. |
Consolidation data; OLAP data comes from the various OLTP Databases |
| Purpose of data |
To control and run fundamental business tasks |
To help with planning, problem solving, and decision support |
| What the data |
Reveals a snapshot of ongoing business processes |
Multi-dimensional views of various kinds of business activities |
| Inserts and Updates |
Short and fast inserts and updates initiated by end users |
Periodic long-running batch jobs refresh the data |
| Queries |
Relatively standardized and simple queries Returning relatively few records |
Often complex queries involving aggregations |
| Processing Speed |
Typically very fast |
Depends on the amount of data involved; batch data refreshes and complex queries may take many hours; query speed can be improved by creating indexes |
| Space Requirements |
Can be relatively small if historical data is archived |
Larger due to the existence of aggregation structures and history data; requires more indexes than OLTP |
| Database Design |
Highly normalized with many tables |
Typically de-normalized with fewer tables; use of star and/or snowflake schemas |
| Backup and Recovery |
Backup religiously; operational data is critical to run the business, data loss is likely to entail significant monetary loss and legal liability |
Instead of regular backups, some environments may consider simply reloading the OLTP data as a recovery method |
|
Data mining: the process of extracting patterns from data. It examines data for trends and patterns.
We can divide IT systems into transactional (OLTP) and analytical (OLAP). In general we can assume that OLTP systems provide source data to data warehouses, whereas OLAP systems help to analyze it.
1. Introduction & Evaluation of SAP BW
A warehouse is subject-oriented, integrated, time-variant, and non-volatile collection of data in support of management’s decision making process (as defined by Bill Inmon).
Data Warehouse: the process of designing, building, and maintaining a data warehouse system.
Tools available in the market: SAP BW, Informatica, Hyperion, data stage, cognos, Teradata
Need of BI System: to generate multi-dimensional reports, for which a multi-dimensional structure should be designed, the multi-dimensional structure is based on schema.
Detailed level data to aggregated data.
Use of information that enables origination to best decide, measure, manage, optimize performance, to achieve efficiency & financial benefits.
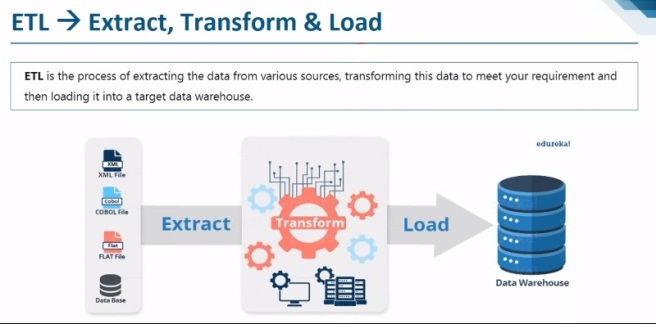
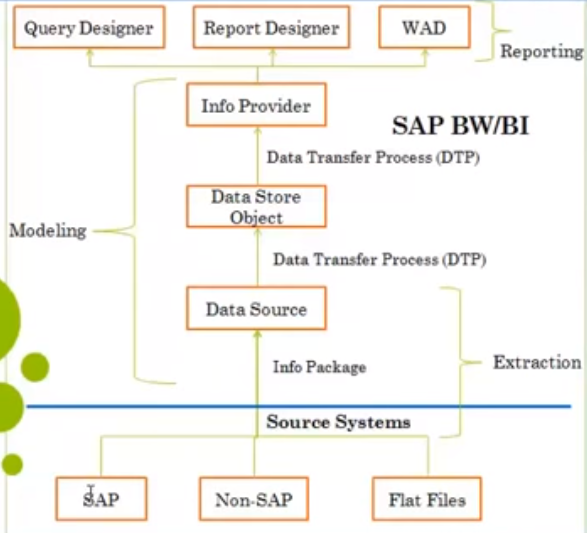
SAP Business Warehouse (BW) integrates data from different sources, transforms and consolidates the data, does data cleansing, and storing of data as well. It also includes data modeling, administration and staging area.
SAP Business Intelligence (BI) means analyzing and reporting of data from different heterogeneous data sources. It allows you to acquire data from multiple data sources, data staging, which can be further distributed to different BI systems. A SAP Business Intelligence system can work as a target system for data transfer or source system for distribution of data to different BI targets.
The Business Explorer (BEx) is a reporting and analysis tool that supports query, analysis and reporting functions in BI. Using BEx, you can analyze historical and current data to different degree of analysis.
BI objects consists of the following components −
- Roles
- Web templates and workbook
- Queries
- Info Provider
- Update Rules
- Info Source
- Transfer Rules
- Info Objects
- Data Sources
BI Architecture
Data Acquisition
Fetches the data from various available sources
Data warehouse
This is the staging layer where processing of data is done in different layers like PSA, DSO, data warehouse
Analytical engine
Bex
BI Accelerator
Process Chain
SP8 for SAP BW 7.4 has introduced BW’s newest modelling object: the Advanced DSO. The Advanced DSO is BW’s new major modelling object that plays a central role in any SAP BW on HANA data model. It is used as a classical DSO, info cube, PSA or write optimized DSO. The Advanced DSO manages to replace all of these objects by basically being all of them when creating the Object you have to decide about the properties the Info Provider shall have.
Sometime we choose Classical DSO option for data provision to next layer and so change log table comes into picture. One thing missing at the moment is the possibility to delete the Change log via process type. But according to SAP this functionality is to come in future (may be BW 7.5).
At this moment, it is possible to do the deletion manually to delete the requests manually in the manage UI but no workaround to delete in batch. However, SAP has recently come with a workaround.
After implementation of this note #2253065, program “RSDSO_REMOVE_REQS_PC “will be available in your BW on HANA system. This program internally calls Function Module M “RSDSO_REMOVE_REQUESTS_API” to delete change log requests in batch.
Activating Drag & Drop:
SM30 -> TM for RSADMINSV -> uncheck Drag & Drop
2. Info Objects
Definition
Business evaluation objects are known in BI as Info Objects.
Info object name must be between 3 & 9 characters long
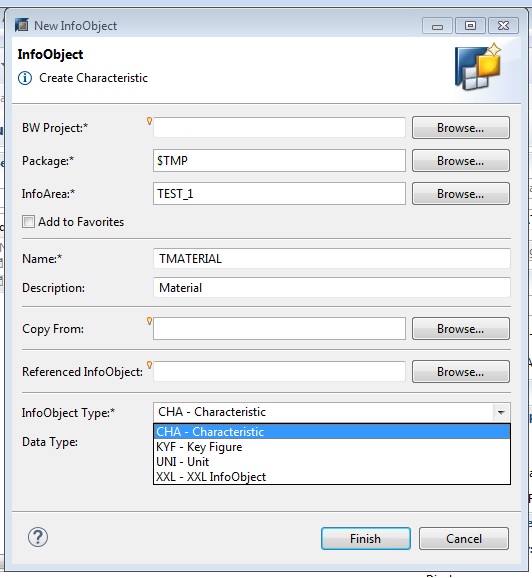
They are divide into
- Characteristics
- All master data are represented with characteristics.
- for example, customers, material, plant
- Key figures
- Units
- Unit gives proper meaning to the key figure
- for example, currency, amount unit like KG, Centimeter
- Time characteristics
- System provides
- We don’t need to create
- for example, fiscal year, fiscal period, Cal day
- Technical characteristics
- Related to system
- We can’t need to create
- Generated internally
- for example, request number
Business Content: pre-delivered well build object developed by SAP when we buy the system.
Use
Info Objects are the smallest units of BI. Using Info Objects, information is mapped in a structured form. This is required for constructing Info Providers.
Info Objects with attributes or texts can themselves also be Info Providers (if in a query).
Info Area: to organize the Info Objects
Max length 30 char, must start with alphabet
Info Object Catalog: Characteristic, key figure
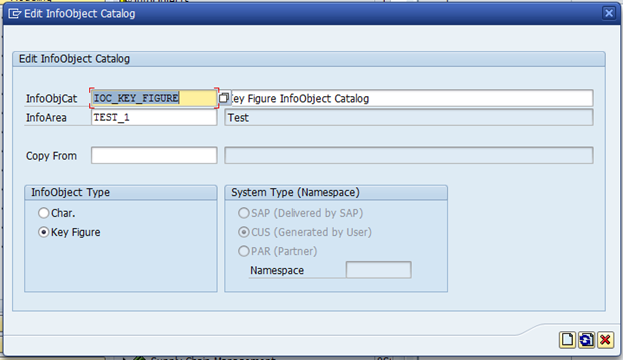
All the Info Objects that comes as a part of Business Content starts with ‘0’
The technical name of custom Info Object should not start with ‘0’ & any special character
Length should be 9
| Reference |
Template |
|
|
| Changes are not possible,
Only description can be changed. |
Changes are possible |
Naming conventions:
- Length of tech name should be 3 to 9 letters
- The generic objects are prefixed with Z or Y
- We cannot start the tech name by using number, since they are reserved for SAP
0 for SAP BW
9 for APO
6 for DB
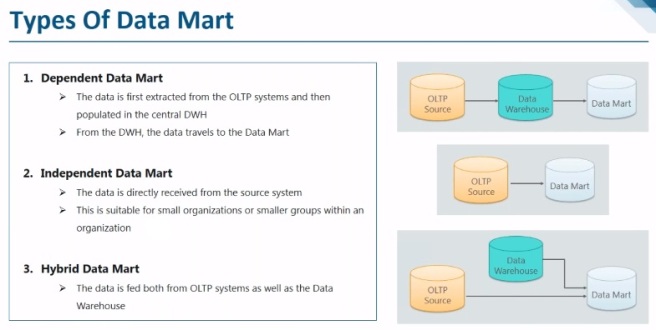
8 for Data marts
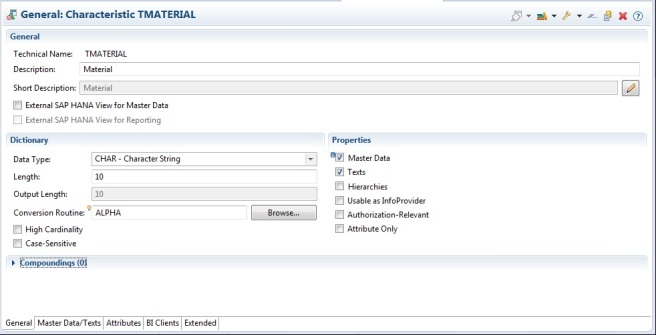
Tabs in char info object:
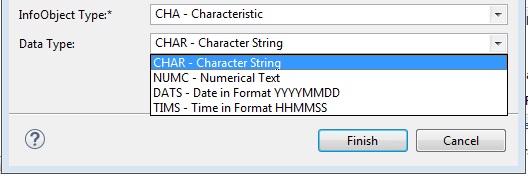
- General:
Data type:
Lowercase letter: Wall Mart-checked, WALL MART-unchecked
Conversion routine: add leading zeroes
Transfer routine: ABAP routine
Attribute only: can’t add attribute, usually won’t use
- Business explores:
Display: using this we can set the display property of a char in reporting
Authorization relevant: security with controlled data access
- Mater data/text:
- Attribute (display & navigational)
- Text
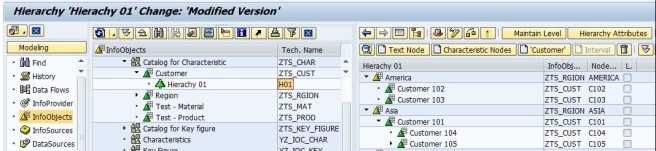
- Hierarchy
Further divided into
- time dependent: Emp name, DOB, DOJ
- time independent: Emp age, designation
There are two types of objects:
SAP delivered: /BI0/
Custom created: /BIC/
Fact table, dimension table, SID table, master data (attr, text, hier)
P — /BIC/P (IO tech name) – time independent master data attr table
Q — /BIC/Q (IO tech name) – time dependent master data attr table
X — /BIC/X (IO tech name) – SID table for time independent nav attr
Y — /BIC/Y (IO tech name) – SID table for time dependent nav attr
S — /BIC/S (IO tech name) — SID table for char
T — /BIC/T (IO tech name) – text table
J — /BIC/J (IO tech name) – hier interval table
H – Hierarchy table
K – Hierarchy SID table
I – SID hierarchy structure
Attribute:
It is an additional information or information given to a char
Types of attributes:
- Display attributes
- Navigational attributes
- Transitive attribute
- Compounding attribute
3. Data Store Object (DSO)
Operational Data Store (ODS-older name)
3.X ODS – now DSO
Data target, Info Provider, Data container, flat structure or 2 dimensional object, works with override(can also be set to additive) functionalities
| BW 3.X |
BI 7.X |
| Standard ODS |
Standard DSO |
| Transactional ODS |
Direct update DSO |
|
Write-Optimized DSO |
Definition
A Data Store object serves as a storage location for consolidated and cleansed transaction data or master data on a document (atomic) level.
This data can be evaluated using a BEx query.
Staging: Cleanse the data or consolidated the data before sending it to the target.
A Data Store object (DSO) is a two dimensional storage unit which mainly stores consolidated and cleansed transaction data or master data on a lowest granularity
- It is a two dimensional Transparent Table.
- Data is stored at detailed level.
- DSO has Overwrite and additive functionalities. If all characteristics are same, key figures are aggregated/overwritten based on the functionality chosen?
- Detailed level reporting can be obtained from a DSO.
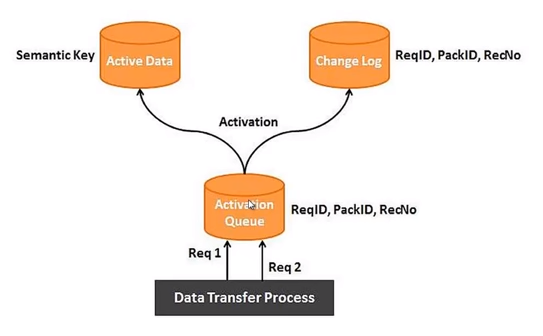
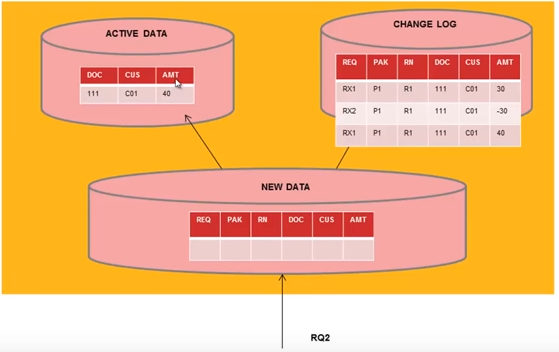
- When we create DSO/ODS it creates 3 tables in backend
Active data table /BIC/AXXXXXX00 – data moved after request activation
New data table /BIC/AXXXXXX40 – data 1st loaded
Change log table /BIC/B000* – complete changes in DSO
Max key fields are 16
Max Data fields 749
Key figure will not come under key fields
| Type |
Standard DSO |
Write-Optimized DSO |
Direct Update DSO-
real time |
| Structure |
Consists of three tables: activation queue, table of active data, change log |
Consists of the table of active data only |
Consists of the table of active data only |
| Data Supply |
From Data Transfer Process |
From Data Transfer Process |
From APIs, DTP not possible |
| SID Generation |
Yes |
No |
No |
| Semantic Groups |
|
|
|
|
Delta update, activation |
Faster, no activation |
|
| Purpose |
Staging |
Initial staging |
|
| Tables |
3 flat tables –
Active data, Change Log, Activation queue |
Active data table |
Active data table |
| Reporting possible |
Yes |
Yes |
Yes |
| Act as/supporting |
Data mart, InfoProvider, ETL supported |
ETL supported, Data mart, Delta mode, |
No ETL, No delta, Data mart |
| Technical Keys |
Key fields, Data fields |
Yes(Req no, Data packet, record no) semantic key is imp to identify duplicate, data field |
APD process |
| Data mart |
Yes, can be loaded to next level |
Yes, can be loaded to next level |
|
| Delete data |
Delete Data
Request wise deletion
Selective deletion
Delete change log data |
|
|
Standard DSO:
PSA -> Activation queue -> change log & activation (active table)
Activation queue remains clear after activation of request
When data is transferred from PSA to activation queue, need to activate the data through request, when request is activated
0RECORDMODE
When standard DSO activated, SAP BW adds the 0RECORDMODE Info Object to the DSO & all the three tables of standard DSO.
This Info Object is used internally by SAP BW.
Write optimized DSO:
Semantic key is the only key combination in active table, it’s like secondary index
Direct update DSO:
The Following APIs exists:
RSDRI_ODSO_INSERT: This API is used to insert new data which does not exist in the system.
RSDRI_ODSO_INSERT_RFC: This is similar to the API “RSDRI_ODSO_INSERT” except that this API can be called remotely.
RSDRI_ODSO_MODIFY: This API is used to modify existing records. If a new record comes in, the record is inserted.
RSDRI_ODSO_MODIFY_RFC: This is similar to the API “RSDRI_ODSO_MODIFY” except that this API can be called remotely.
RSDRI_ODSO_UPDATE: This API is used to modify existing records.
RSDRI_ODSO_UPDATE_RFC: This is similar to the API “RSDRI_ODSO_UPDATE” except that this API can be called remotely.
RSDRI_ODSO_DELETE_RFC: This API is used to delete records.
4. Info Cubes
Selective deletion Program: RSDRD_DELETE_FACTS
Cube is additive in nature. If all characteristics are same, key figures are aggregated.
1. Schema
Logical arrangement of the tables with business data.
Schemas are used to define a info cubes
Fact is event that can be counted or measured
Tables contains maximum of 16 primary keys & hence we can attach 16 dimension table to fact table
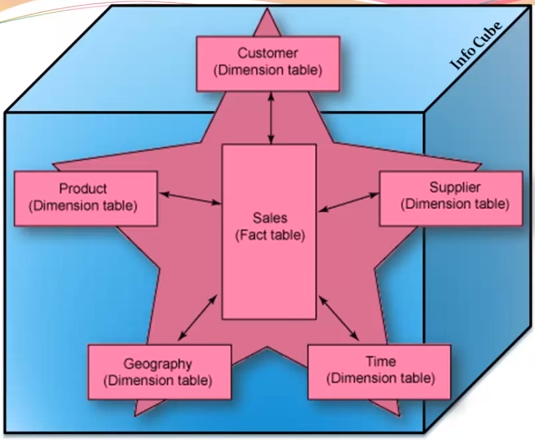
Star Schema
Simplest form of a dimensional model, in which data is organized into fact & dimensions.
Each dimension is joined to one single fact table. Each dimension is represented by only one dimension and it is not further normalized. A dimension Table contains a set of attributes that are used to analyze the data.
Each dimension table is connected to a fact table as the fact table has the primary Key for each dimension tables that are used to join two tables.
Facts/Measures in the Fact Table are used for analysis purpose along with the attribute in the dimension tables.
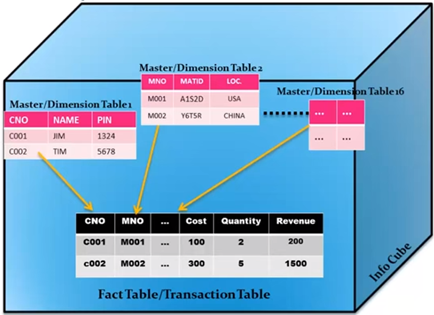
Disadvantages of star schema:
Since the master data is inside the cube so reusability is reduced.
It has Alphanumeric key are slower to process than numeric key.
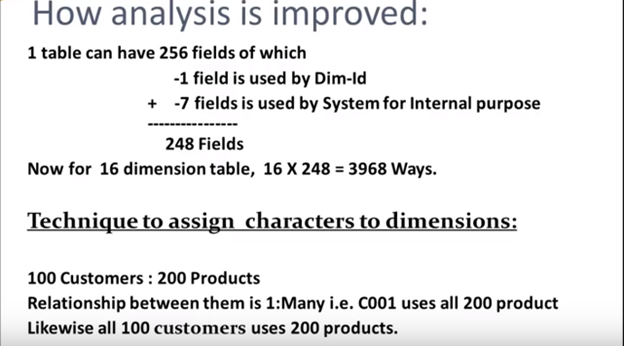
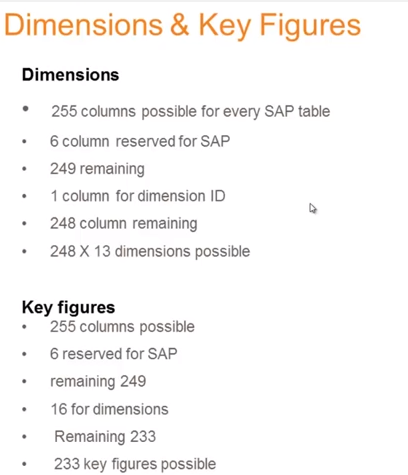
The analysis can be done only for 16 characters
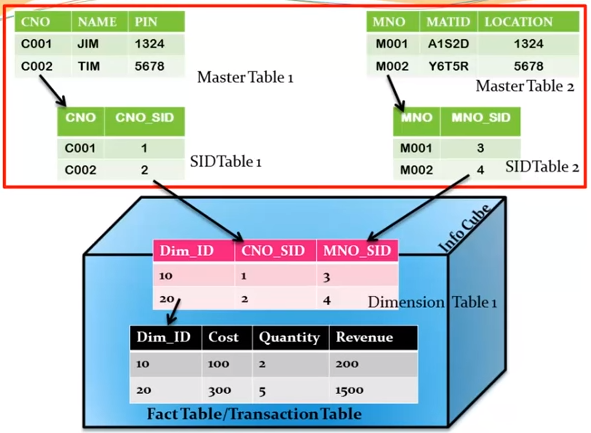
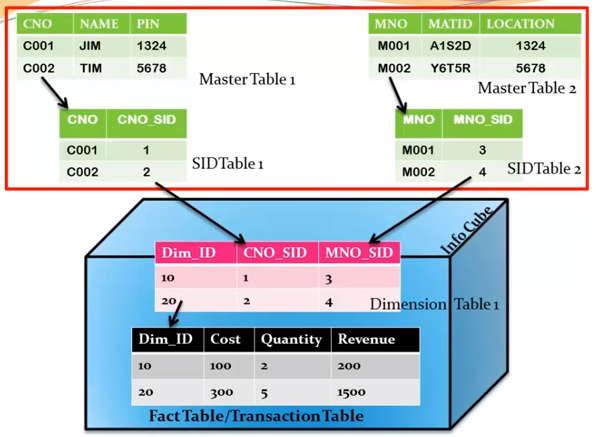
Extended Star Schema
In Extended Star schema, fact tables are connected to dimension tables and this dimension table is further connected to SID table and this SID table is connected to master data tables. In an extended star schema, you have the fact and dimension tables inside the cube, however SID tables are outside the cube. When you load the transactional data into the Info cube, the Dim Id’s are generated based on SID’s and these Dim ids’ are then used in the fact tables.
In the extended star schema one fact table can connect to 16 dimension tables and each dimension table is assigned with 248 maximum SID tables. These SID tables are also called as characteristics and each characteristic can have master data tables like ATTR, Text, etc.
- ATTR − It is used to store all the attribute data.
- Text − It is used to store description in multiple languages.
Mater data outside the cube so can be reused by multiple cube.
SID: alphanumeric key has converted to numeric, hence performance improved
Improved the analysis of report by around 4000 ways
5. Other Info Providers
1. Multi providers
2. Composite Provider
A Composite Provider is an Info Provider that combines data from several analytic indexes or from other Info Providers (by union or inner join or left outer join), and makes this data available for reporting and analysis.
The authorizations for working with Composite Providers are assigned using authorization object S_RS_CPRO.
The analysis authorizations are created from a combination of the authorizations for the Composite Provider and the authorizations for its sub objects.
Restrictions
A Composite Provider can only be transported if it consists solely of Info Provider.
You cannot use non-cumulative key figures in a Composite Provider.
For real-time Info Cubes, the open request is not read in the query, even if you have made the corresponding data integrity setting in Query Designer.
3. Info Sets
4. Semantically Partitioned Objects
5. Hybrid Providers
6. Transient Providers & Composite Providers
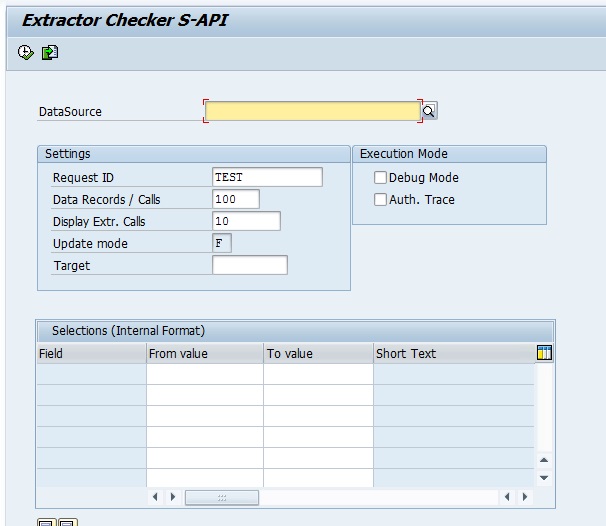
6. ETL process (Extraction, Transformation, & Data Loading)
1. ETL capabilities in SAP BW
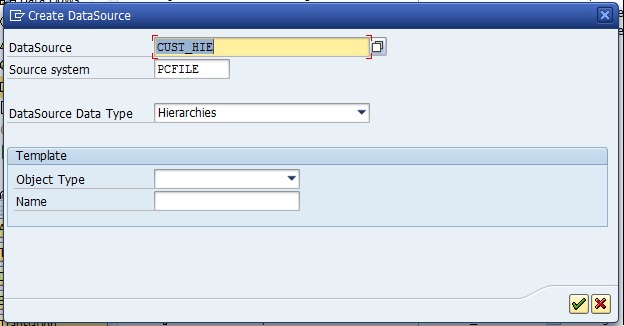
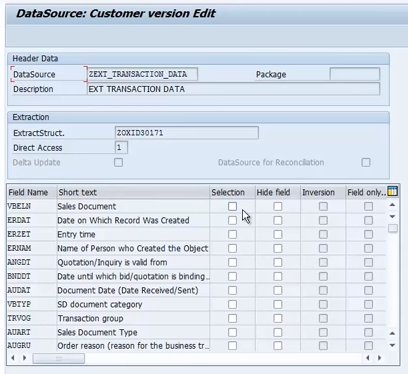
2. Data Source
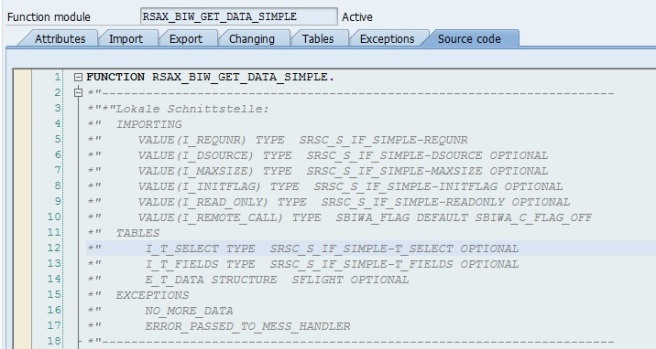
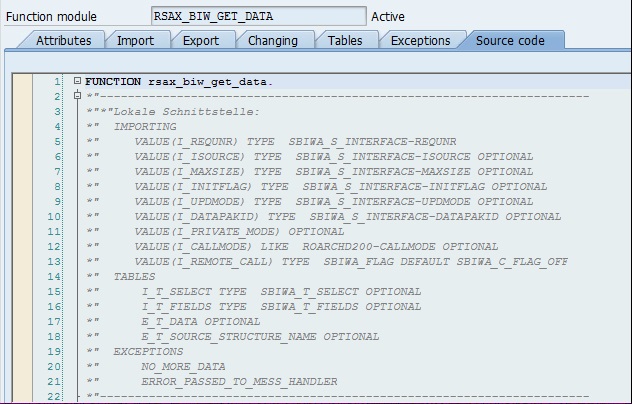
Extraction from ECC(generic data source):
RSO2
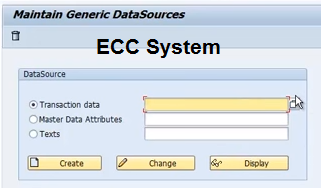
Create
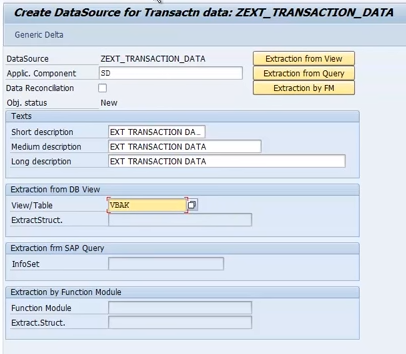
RSA6
Check data source is activated or not
That’s it done from ECC side.
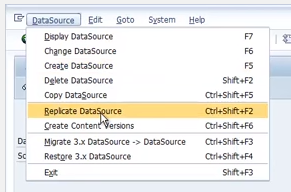
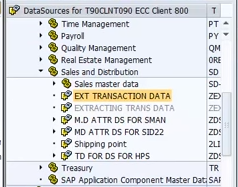
BW side:
RSA13
Check the connection
Double click on connection (application component) -> Replicate the data source
RSDS (replicate specific data source)
Create Info Package -> schedule -> monitor -> Create Cube/DSO -> Create transformation -> Create DTP
3. Info Package (Source to Data source)
The Info Package is an entry point for SAP BI to request data from a source system.
IP is a data loading Scheduler from which you can execute your extraction of data from Source system. It contains information about when & from which data source.
In BW 3.5 IP can be used to load data in PSA as well as in data targets from source system but in case of BI 7.0 it is restricted to PSA only; further DTP can be used.
Extract data from source system & load it to PSA (Data source)
IP is specific to data source
Data selection: Fixed value, Dynamic (ABAP routine)
How to create?
Write click on Data source & select create info package
IP name starts with ZPAK_* which is system generated, we can give only description to it.
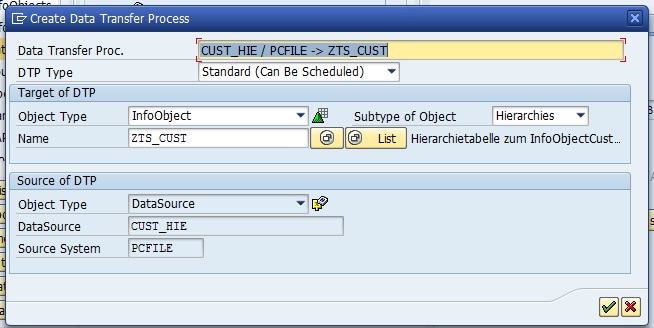
4. Data Transfer Process (DTP): (DS to DSO, DSO to Cube, DSO to DSO etc.)
DTP determines how data is transferred between two persistent objects (PSA to data target like, CUBE or DSO or Info Object or External systems), with respect to transformations and filters
DTP replaced IP in BI 7.0 for loading the data to data targets and data marts.
DTP has separate Source to Target Delta handling mechanism.
Deleting the data mart deletes the request itself not just status as in case of IP.
DTP filter’s the data based on Semantic Key which is not possible in IP.
Breakpoint can be set at data packet level at all the stages (Before Extraction, Before Data Transfer and
After Data Transfer.) Whereas, breakpoint doesn’t exist in IP.
Temporary Data Storage and Error Stack improve error handling in DTP which doesn’t exist in IP.
DTP is faster as DTP data loading is optimized by Parallel process.
Data loading through DTP has no TRFC/LUWs generated at run time thus minimizing the loading time.
It’s possible to migrate from IP flow to DTP flow if you are in BI 7.0 or above.
Create a DTP and set the Processing mode Serial Extraction, Immediate parallel processing to switch from IP to DTP without data loss.
DTP can be used to load the data in the following situations:
- Loading data from DSO to DSO/CUBE, CUBE to CUBE
- Real time Data Acquisition
- For Data Direct Accessing.
- Loading data from BI to External systems (for example Open Hub Destinations)
Advantages of DTP:
- Delta Management
- Handling duplicate records
- Filters
- Parallel processing
- Error Handling
- Debugging
5. Transformation
6. Routines
7. Loading of master data & transaction data
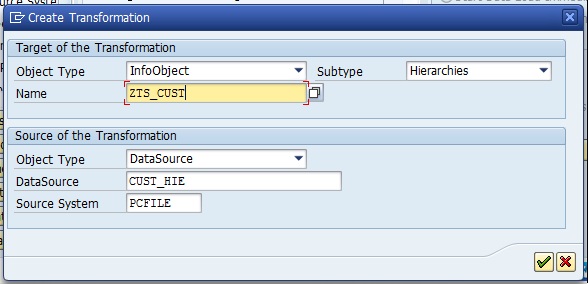
7. Transformation
The Transformation process is used to perform data consolidation, cleansing and data integration. When data is loaded from one BI object to other BI object, transformation is applied on the data. Transformation is used to convert a field of source into the target object format.
Each Transformation consists of minimum one transformation rule. As different rule types and routines are available that allows you to create simple to complex transformations.
Transformation Rules
Transformation rules are used to map source fields and target fields. Different rule types can be used for transformation.
- Rule Type − A rule type is defined as an operation applied on the fields using a Transformation rule.
- Rule Group − It is defined as the group of transformation rules and each key field in the target contains one transformation rule.
- Transformation Type − It is used to determine the transformation values and how data is entered in the target.
- Routines − Routines are used to perform complex transformations. Routines are defined as local ABAP classes and it consists of predefined definition and implementation area.
A Routine is created in implementation area and inbound and outbound parameters are defined in definition area. Routines can be defined as transformation rule for a key figure and they are available as rule types.
- Real-Time Data Acquisition (RDA)
Real-time data acquisition is based on moving data to Business Warehouse in real time. Data is sent to delta queue or PSA table in real time. The real time data acquisition is used when you transfer data more frequently – hourly or every minute and data is refreshed at the report level multiple times in a single time interval.
Real-time data acquisition is one of the key properties of data source and data source should support real time data acquisition. Data Source which are configured to transfer data in real time they can’t be used for standard data transfer.
Real time data acquisition can be achieved in two scenarios −
- By using InfoPackage for real time data acquisition using Service API.
- Using Web Service to load data to Persistent Storage Area (PSA) and then by using real time DTP to move the data to DSO.
Real-time Data Acquisition Background Process −
To process data to InfoPackage and data transfer process DTP at regular intervals, you can use a background process known as Daemon.
Daemon process gets all the information from InfoPackage and DTP that which data is to be transferred and which PSA and Data sore objects to be loaded with data.
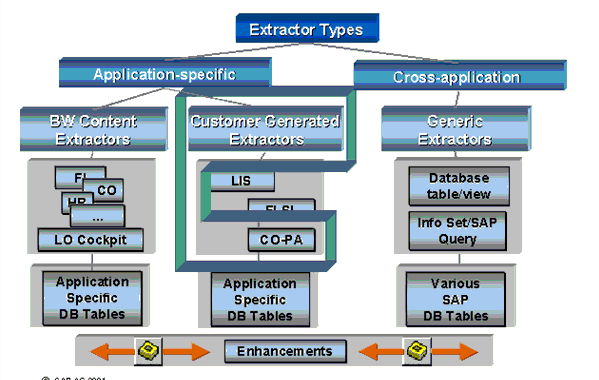
8. Data extraction from Source System
Loading data from ECC to BW system using standards extractor
Custom or generic extractor
Data extraction from non-sap system sources using UD connect (Universal) or DB (Database) connect
9. Creating queries using BEx Query Designer
Creating simple BEx query
Creation of OLAP variables
Creating filters
Creation of structures
Creating selection & formulas
Creating RKF & CKF
Creating conditions & exceptions
10. BEx analyzers & report designer
Running queries in BEx analyzer
Creating workbook
Local properties & formulas in BEx analyzer
11. Web Application Designer WAD
WAS Web Application Service
12. Administration & monitoring
1. Process chains
Display component is the folder for Process chain.
Subcomponents cannot be created under generated components (unassigned nodes).
Definition
A process chain is a sequence of processes that are scheduled to wait in the background for an event. Some of these processes trigger a separate event that can, in turn, start other processes. It provides various connectors that allow alternative and parallel execution of process.
Process chains provide graphical scheduling & monitoring features to help in automation, visualization & monitoring of tasks / processes.
Use
In an operating BI system there are a multitude of processes that occur regularly. If you use process chains, you can:
- Automate the complex schedules in BW with the help of the event-controlled processing,
- Visualize the processes by using network graphics, and
- Centrally control and monitor the processes.
Run in background
PC are grouped by components
Features −
- Security
- Flexibility
- Openness
Process Chain involves three main steps:
RSPC -> create -> variant ->
Start Process: It describes when the process will start (immediately, scheduled job, met process, API)
Connector: It is a linking process, and can choose options of starting next process
Variant: The object on which we are supposed to execute the process is called as Variant. It is a set of parameters passed to the process like name of the Info Package or Info-Objects
Transaction code:
RSPC is the whole and sole transaction used for Process Chain Maintenance.
RSPCM This is used to monitor daily process chains.
In this screen, existing process chains are sorted by “Application Components”.
There are two views available:
- Check View
- Planning View.
The default mode is Planning View.
If the data load is to be done via an Info Package, use the Process type “Execute Info Package”
If the data load is to be done via a DTP, use the Process type “Data Transfer Process”
For any subsequent step, we can choose if the successor step shall be executed only if the predecessor.
- Was successful: typically used in normal processing
- Ended with errors: Typically used to send failure messages
- Execute irrespective of success or failure of previous step
Steps to Check Consistency of Process Chain: Go to -> checking view
Create event from transaction SM62
BP_EVENT_RAISE is a standard SAP function module that performs Trigger Background Event functionality.
Sequence of processes:
Loading data into DSO
Activating the DSO data
General services supported by process chain
Variant
Set of parameter to execute any job in the background
Without variant background job can’t be started
2. Analysis authorizations
3. Aggregations
4. Compression
5. Info Cube & DSO administration
13. Advance features
Open Hub Destination (OHD): BW to other system
Analysis Process Designer (APD):
14. SAP BW powered by HANA
Disc base & in memory database
Intro
In memory Info Cube
In memory DSO
Importing SAP BW models into HANA analytic view
Creating transient provider on HANA analytic view
Creating semantic partition objects (SPO’s)
LSA & LSA++ architecture (layer & scalable architecture)
Composite provider
Advance DSOs, ODP, LSA++, BW objects exposed as HANA views
Eclipse based modeling tools
Schemas & tables on HANA analytical view, calculation view in HANA studio
SOL-scripting procedures(SQLSCRIPT in HANA)
15. SAP BW – BO integration
BO intro
Integration landscape
Create OLAP connection using IDT
Connecting to Web intelligence
Connecting to explore
Connecting to crystal report 2011 & enterprise
Connecting to analysis office for OLAP & MS office
Connecting Dashboards